When sales teams ask about inventory size, they usually want one simple answer: “How many impressions can we sell?“
In Google Ad Manager, this is not one fixed number. Inventory depends on traffic, demand, and setup. This article explains how to use historical reports to understand inventory size for planning, and how to use this data correctly.
Inventory Size vs Available Inventory
First, it is important to separate two terms.
Inventory size
- Shows how many impressions an ad unit usually delivers
- Based on historical data
- Used for planning and packaging
Available inventory
- Shows how many impressions are still free in the future
- Based on current demand and reservations
- Calculated only in Forecasting
This article focuses on inventory size for planning, not final availability.
Why Historical Reports Are Useful for Planning
Historical reports show what really happened on the site. They help ad ops and sales teams understand:
- Which ad units are strong
- Which ad units are saturated
- How stable traffic is month by month
- What volumes are realistic to discuss with clients
This data is often used before running a forecast.
Recommended Report Setup
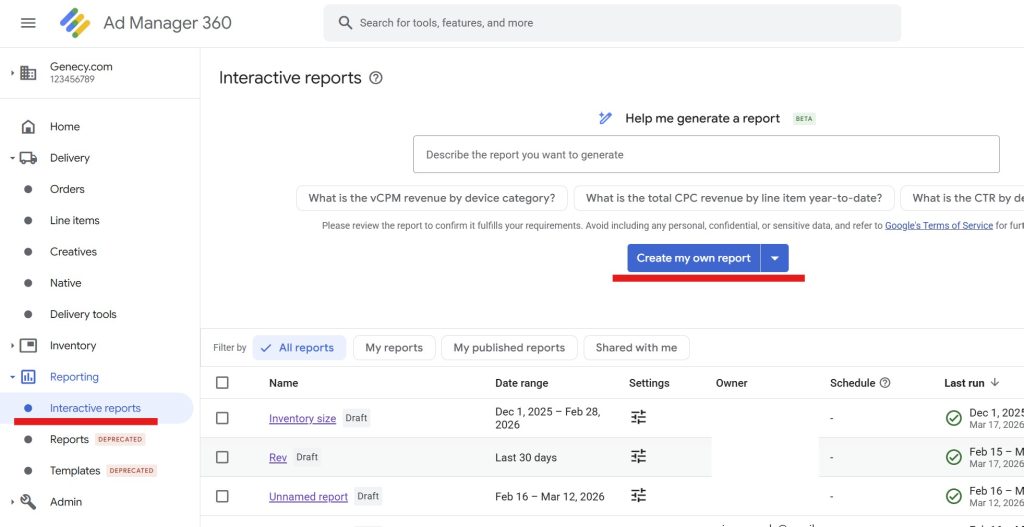
Sign in to your Google Ad Manager account, go to Reporting, and select “Interactive reports.“ Then click “Create my own report.“ By default, this creates a Historical report, which is what you need. Please make sure that the selected report type is Historical.
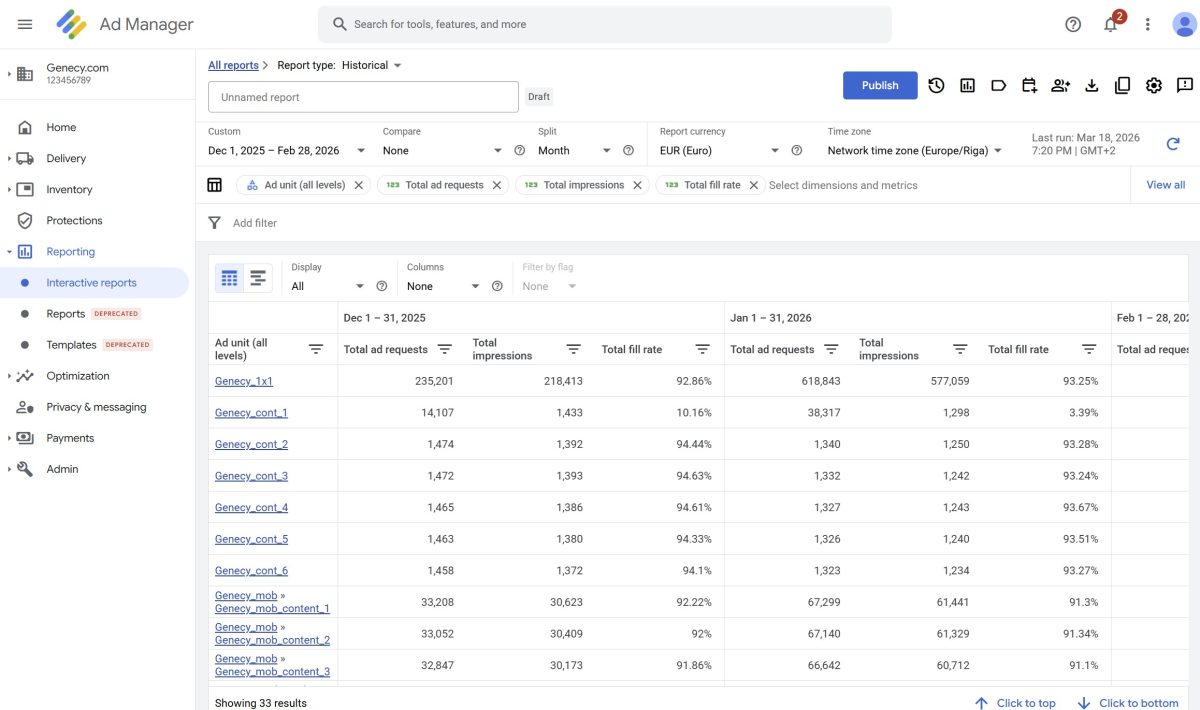
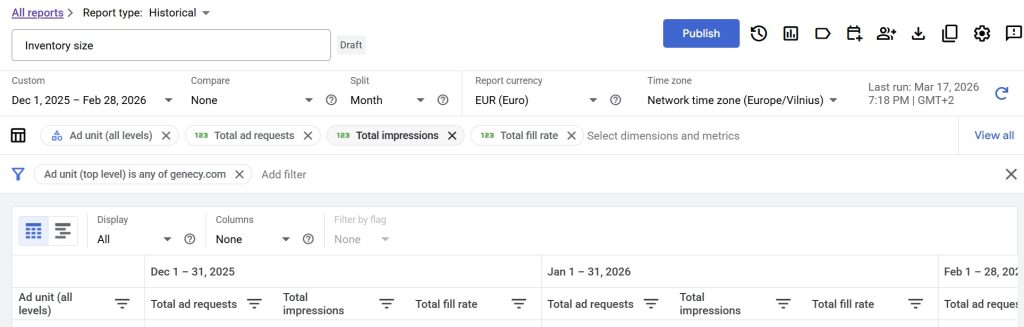
To understand inventory size by ad unit, use a Historical report with these settings:
| Dimension | – Ad unit (all levels) or Placement |
| Metrics | – Total ad requests – Total impressions – Total fill rate |
| Date range | – Last 3 full months or last 6 full months – Split by month |
Select the period from the first day of the month to the last day of the selected month. This is important because the “split by month” option splits by calendar months, not by ~30-day periods.
If you select something like the last 90 days, the report will usually be split into 5 months, where the first and last months are only partial.
This setup gives a clear picture of capacity and demand.
Using Averages for More Accurate Planning
To get more stable numbers, it is recommended to export the report to Excel (or Google Sheets) and calculate averages.
Steps:
- Export the report
- Calculate the average impressions per ad unit
- Optionally calculate average fill rate and ad requests
This helps to:
- Smooth out traffic spikes
- Avoid planning based on one strong or weak month
- Get a more reliable baseline for sales discussions
How to Read the Numbers
These numbers should be treated as a working baseline, not as guaranteed inventory.
Each metric shows a different part of inventory.
1. Total Ad Requests
This is the theoretical maximum.
It shows how many times an ad unit was requested.
High ad requests mean:
- Strong traffic
- Potential for growth
2. Total Impressions
This shows real delivered inventory.
It is the most important number for planning.
This answers:
- This shows the typical monthly volume of the ad unit.
- What volume sales can work with
3. Fill Rate
Fill rate shows how much of the inventory is already used.
Examples:
- High impressions + high fill rate → saturated placement
- High requests + low fill rate → growth opportunity
Fill rate helps understand pressure on inventory.
If your fill rate is already high, the next step is not more demand, but better-performing creatives. You can explore formats like Parallaxer to increase CTR and revenue per impression.
Using Viewability as a Bonus Metric
If you sell premium or viewable inventory, add viewability rate to the report.
Recommended metrics:
- Active View measurable impressions
- Active View viewable impressions
Viewability shows the real sellable quality of inventory.
Example:
- 3M impressions
- 65% viewability
In reality, only ~2M impressions are viewable.
This is important for planning premium campaigns.
How Sales and Ad Ops Use This Report
Sales teams use it to:
- Build media kits
- Package placements
- Set realistic expectations
- Discuss monthly volumes
Example: “This mobile top ad unit usually delivers around 2.5-3M impressions per month.”
Ad ops teams use it to:
- Validate deal sizes
- Spot risky ad units
- Compare with forecasting results
- Avoid overpromising inventory
This report is often the first step before forecasting.
What This Report Does NOT Do
This report does not:
- Show future available inventory
- Replace Forecasting
- Guarantee delivery
Before confirming any campaign, inventory must always be checked in Forecasting.
Common Mistakes
- Calling this “available inventory”
- Using only one month of data
- Ignoring fill rate or viewability
- Promising volumes without forecasting
Historical data is for planning, not booking.
Final Thoughts
Historical reports are a strong tool to understand inventory size. They help teams plan, package, and communicate better.
One simple rule to remember:
- Use historical reports to understand capacity.
- Use forecasting to confirm availability.
Used together, they help avoid delivery problems and unrealistic promises.
Want to get more revenue from the same inventory?
Explore ready-to-use rich media templates for Google Ad Manager.